Now You Can Really Know your Network
FlowViewer is an open-source solution for the visualization of network traffic through the capture and analysis of netflow data. Because it is open-source and most network devices already provide netflow data, FlowViewer provides you with a comprehensive network traffic solution essentially for free.
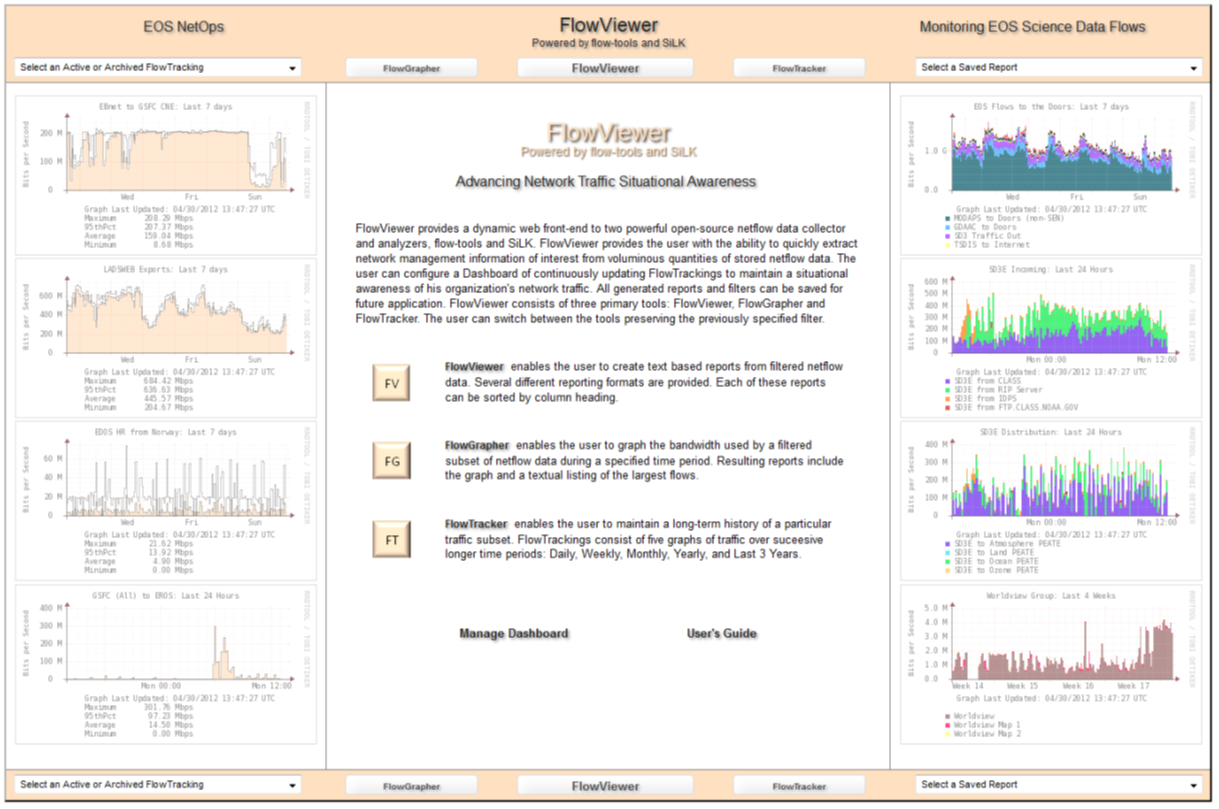
FlowViewer sits on top of Carnegie Mellon's robust, high-performance SiLK netflow data capture-analysis software and consists of three major component tools: FlowViewer, FlowGrapher and FlowMonitor (see below.)
FlowViewer reveals the who, what, where, when and how of traffic over your network. Multiple dashboards allow your different organizations (e.g., Security, Operations, etc.) to focus on proprietary concerns on a live operational basis.
With the CAPEX savings FlowViewer offers, you can consider our Service Options which include installation support and training to bring your network organization up to speed quickly.

FlowViewer consists of three component tools:
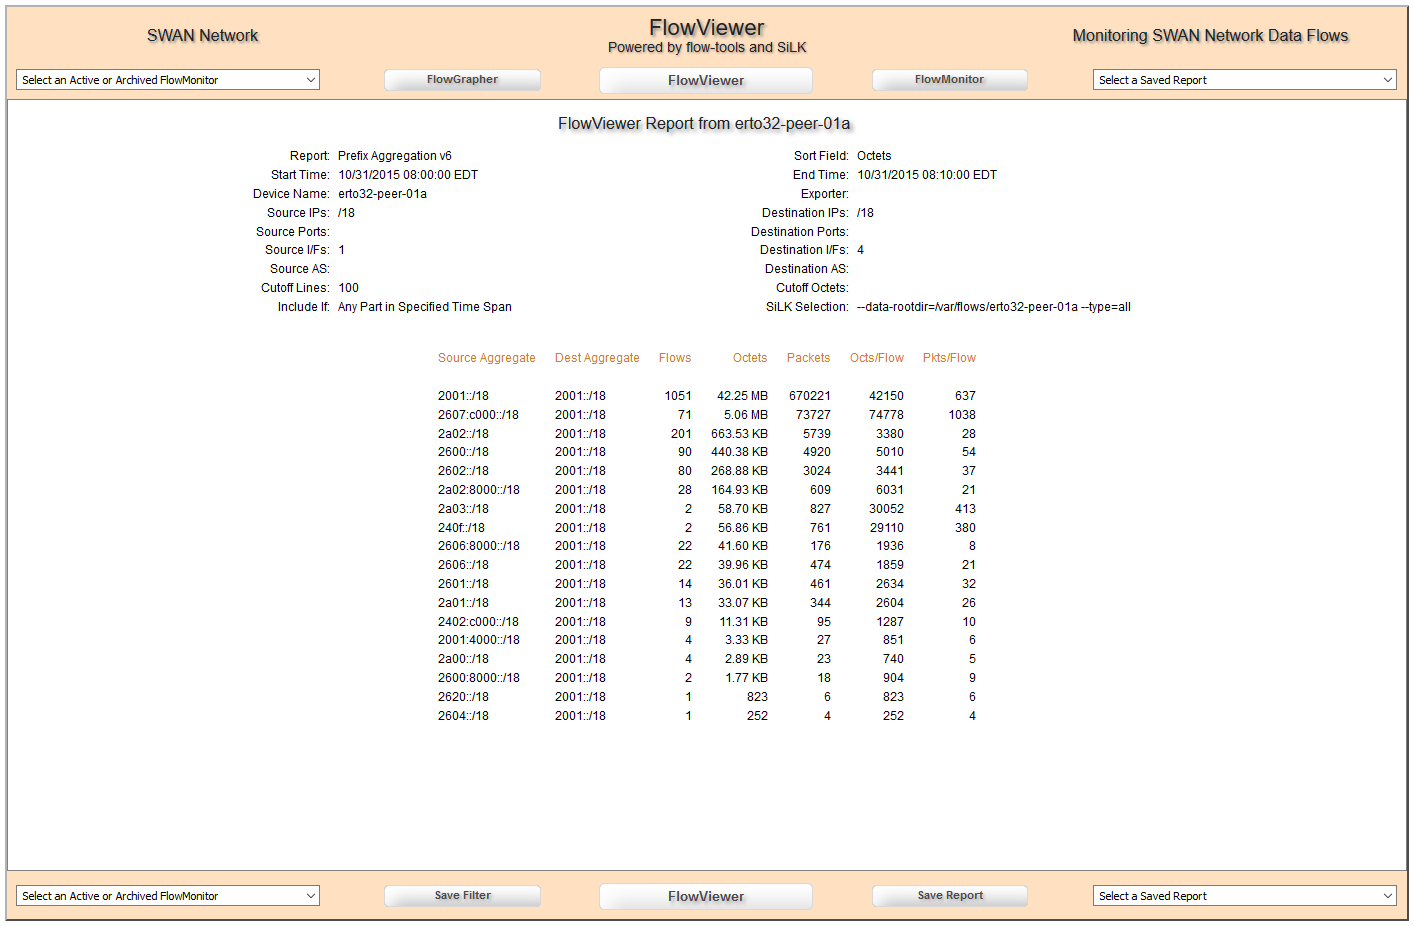
- Text based reports
- Extensive filtering (CIDR, ranges, exclusion, more...)
- Filter by Address, Port, Interface, AS (Src or Dst)
- IPv4 and IPv6
- More Filtering: TOS, TCP Flags, Protocols, Next Hop
- Over 30 reports
- Save reports and filters
- Return to active filtering from a saved report
- Rapidly sort on any column
- Quick jump to other tools with filter kept in place
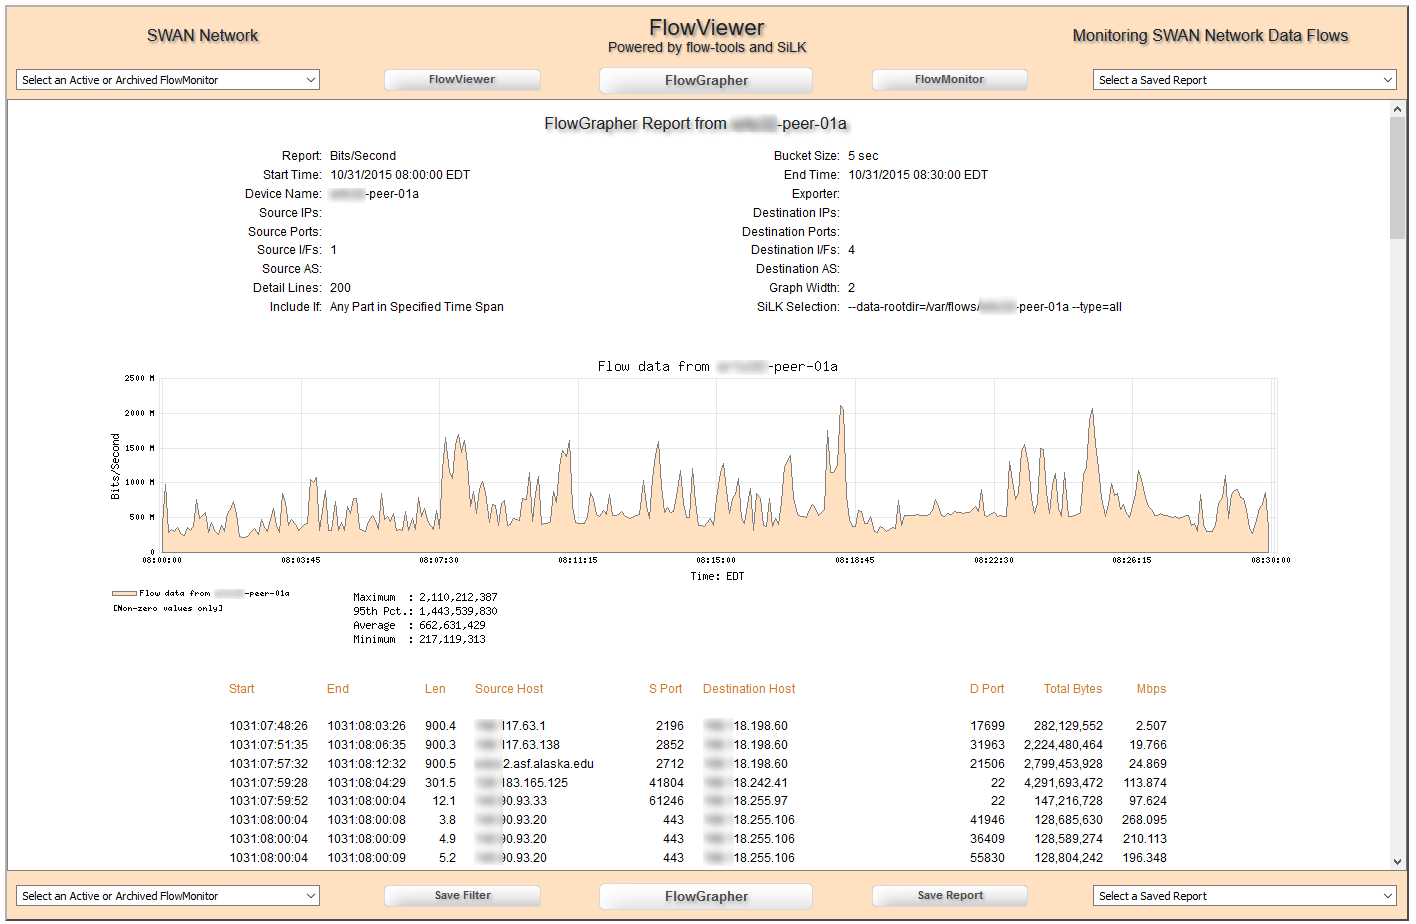
- Graphs for bits/sec, flows/sec, pkts/sec
- Detailed graphs over specified time period
- Text report of largest traffic contributors
- Quick column sort on report
- Same extensive filtering (see FlowViewer tool)
- Multi-color analytical graphs segment traffic
- Save reports and filters
- Return to active filtering from a saved report
- Rapidly sort on any column
- Quick jump to other tools with filter kept in place
- FlowMonitor = RRD graphs for filtered traffic
- Can be used for billing purposes
- Note significant changes in long term trends
- Last: 24 Hours, 7 Days, 4 Weeks, 1 Years, 3 Years
- Ability to list individual values for all graphs
- Graphs peak period value as well as aggregated average
- Keep critical FlowMonitors on Dashboard
- Return to active filtering from a FlowMonitor report
- Quick jump to other tools with filter kept in place
- Period Maximum, Minimum, Mean, 95th Percentile
Next Steps...
Contact the author Joe Loiacono to begin one of the support services


